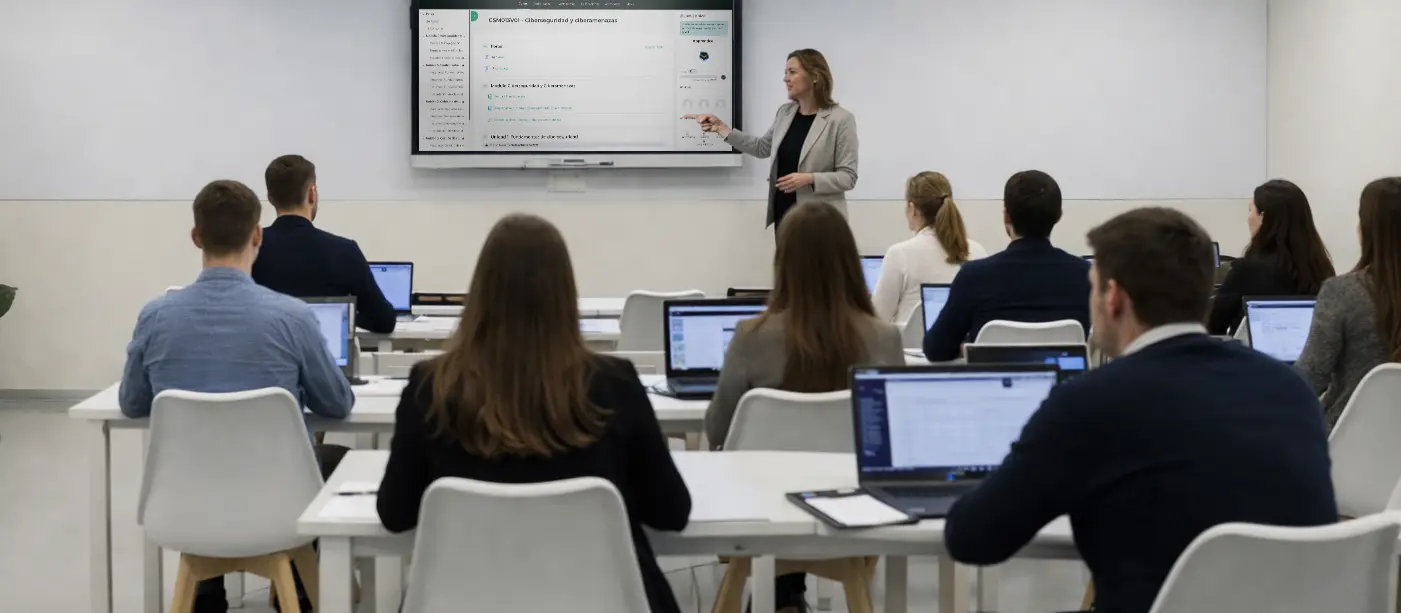
Masters and technology bootcamps in Madrid

Dialogues
Tecnología, geopolítica y negocio: las claves para entender lo que viene
Una conversación con mujeres referentes para entender cómo el contexto global está redefiniendo las decisiones empresariales y profesionales.
Evento online, 23 de abril a las 9:30h.

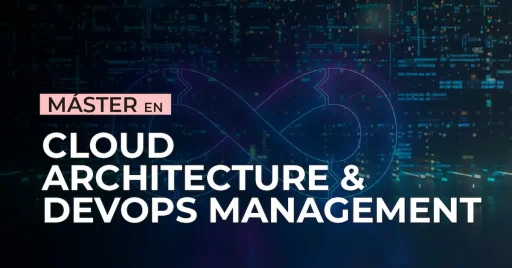
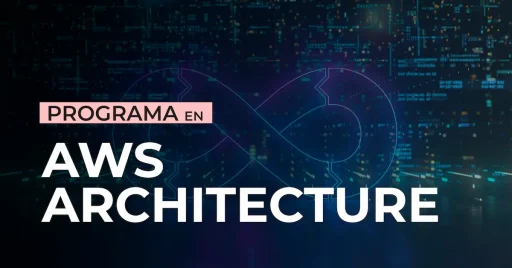
Master in Cloud Architecture & DevOps Management
Technical specialisation in AWS, Azure, or Google Cloud. The programme covers everything from architecture design to deployment using DevOps methodologies, including portfolio building and preparation for official certifications on your chosen platform.
Intake Octubre 2026

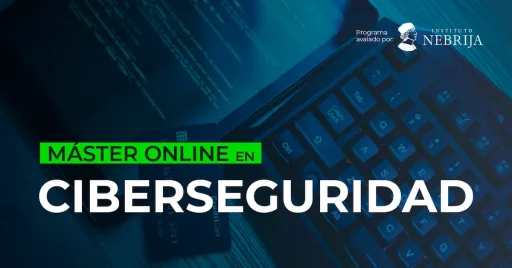
Master's Degree in Cybersecurity Online
Technical training based on practical experience in real-world SOC environments. The programme focuses on developing incident response capabilities and ethical hacking audits. It includes preparation for official Cisco and Microsoft certifications, tailoring your professional profile for SOC Analyst or Pentester roles.
Intake Junio 2026


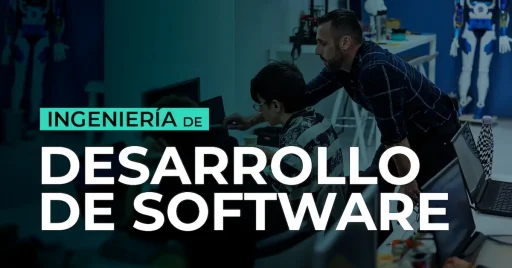
Software Development Engineering
A 3-year full-immersion programme merging Software Engineering, AI, and the Humanities. Build a portfolio with thousands of hours of code and earn an official degree from Dublin Business School in an unparalleled international experience. Master the most in-demand technologies and build the technical profile that top-tier companies are looking for.
Intake September 2026
Academic offering
-

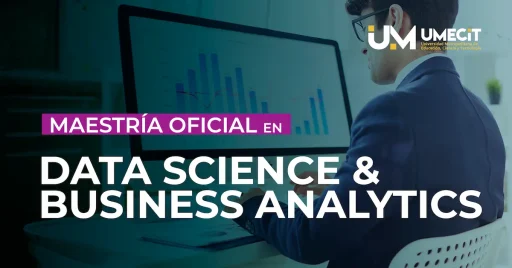
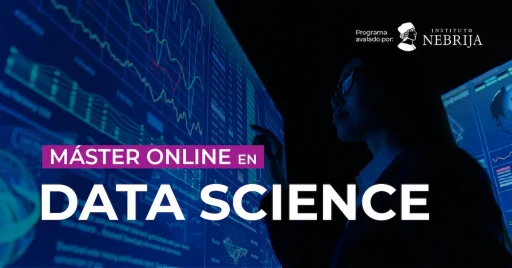
Data Science & Business Analytics Master
Live online classes
Próxima convocatoria: Octubre 2026
60 Credits
-
-
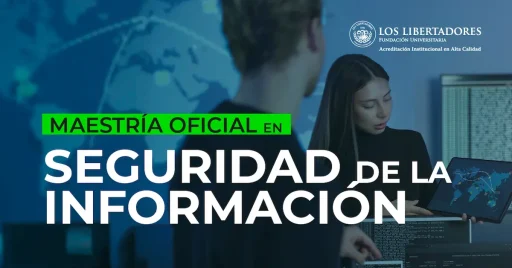
Official Master's Degree in Information Security
Live online classes
Próxima convocatoria: Octubre 2026
60 Credits
-
Software Development Engineering
On-campus
Próxima convocatoria: Septiembre 2026
3 years + 1 optional year at DBS (180 credits)
-
-
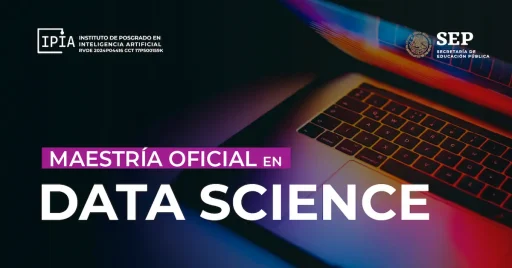
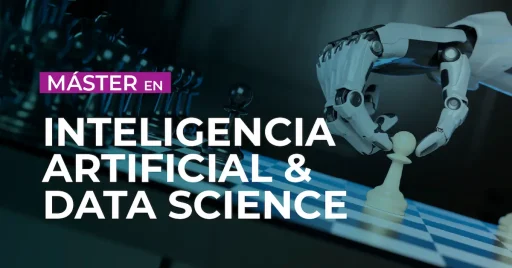
Artificial Intelligence & Data Science Master
On-campus / Online classes live
Próxima convocatoria: Marzo 2026
75 Credits
-
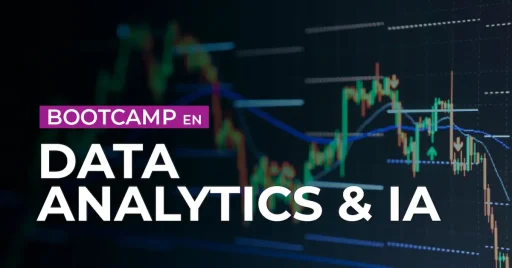
Data Analytics & Artificial Intelligence Bootcamp
On-campus / Online classes live
Próxima convocatoria: Octubre 2026
30 Credits
-
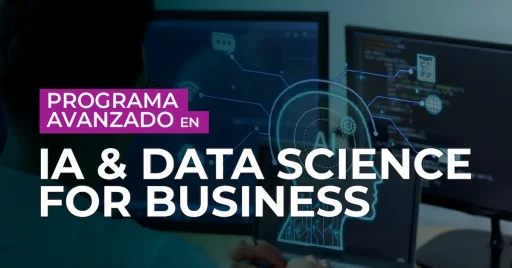
AI & Data Science for Business Advanced Program
Live online classes
Próxima convocatoria: Octubre 2026
45 Credits
-
-
Master in Cloud Architecture & DevOps Management
Live online classes
Próxima convocatoria: Octubre 2026
60 Credits
-
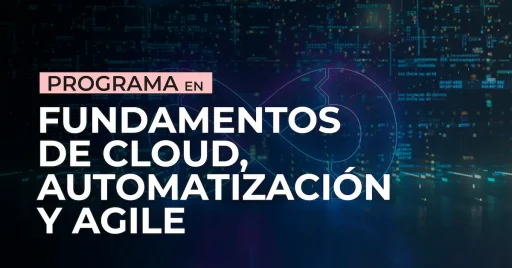
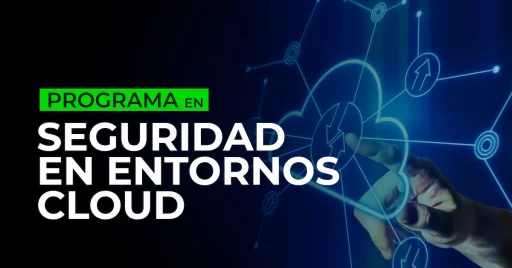
Program in Cloud Foundations, Automation, and Agile
Live online classes
Próxima convocatoria: Octubre 2026
10 Créditos
-
-
-
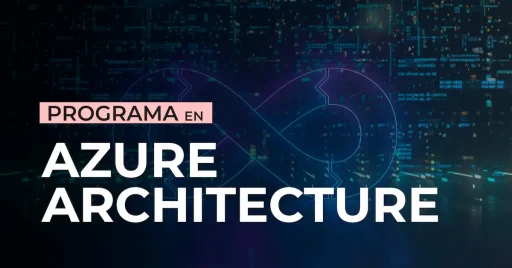
Program in Google Cloud Architecture
Live online classes
Próxima convocatoria: Octubre 2026
28 Créditos
-
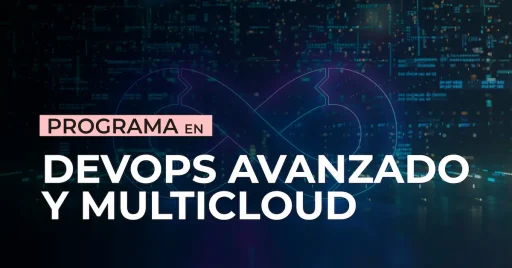
Program in Advanced DevOps and Multicloud
Live online classes
Próxima convocatoria: Octubre 2026
16 Créditos
-
-
-
-
-
-

Professionals
Maria Riesco
Master’s in Cybersecurity Director | Head of Spanish National Police Cybersecurity Group

Rodrigo Moro
Master’s in Cloud Architecture & Devops Management Director | Tech. Arch. Delivery Manager

Ángel Galán
Data Science & AI Area Director | Cloud Data Analytics Director

Carlos Carús
Cloud Computing Area Director | Head of Technology

Unai Obieta
CIO & CDO | Technology & Digital Transformation Director
Javier G. Recuenco
Director of the Complex Problem Solving in Technology Course | CEO & Founder

Miguel Rego
Cybersecurity Area Director | President of AI Cluster, General Manager | CEO

David Ollé
Master’s in Cloud Computing Director | AWS Cloud Architect

Victor Deutsch
Programming Area Director : CEB Director

Olga Muñoz Ramos
UX/UI Design Bootcamp Director

What people say about us
Technology partners
Cisco
CompTIA
Google Cloud
Microsoft Azure
PUE Academy
Academic partners
Amazon Web Service (AWS)
Alastria
HP SCDS
Santander

Cybertalent
Do you have a cybersecurity-related project that you would like to develop? Have you identified a cybersecurity need? Do you need funding to launch your company? IMMUNE, in collaboration with INCIBE, is developing the CYBERTALENT program, a three-year plan to promote cybersecurity entrepreneurship in Spain.


Phase 1: Recruitment / Ideation
Get ready through our events

Phase 2: Seedbed Incubator
Develop your idea and get it up and running

Phase 3: Acceleration
Grow your business with the support of Incibe


Visit our Campus in Madrid and discover everything about our programmes
- Personalised guidance Monday to Friday.
- Intake now open for March, September and October.
Designed to replicate an ecosystem of start-ups and tech companies, we’ve created a slice of Silicon Valley in the heart of Madrid.