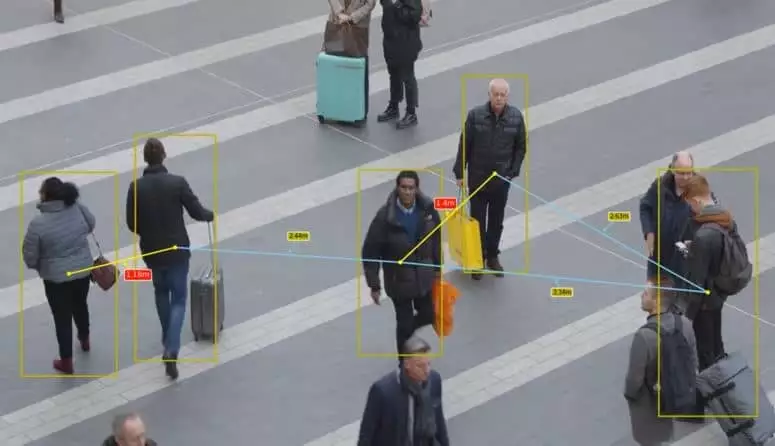
Using TensorFlow Object Detection API to detect pedestrians and measure the social distance between them.
Hoy, por desgracia, todo el mundo está familiarizado con el término «distancia social». Es algo con lo que tendremos que vivir por un tiempo hasta que todo vuelva a la normalidad. En Immune Technology Institute we have developed an application using TensorFlow Object Detection API to identify and measure the social distance between pedestrians in real time.
Wait a minute... What is the TensorFlow Object Detection API?
TensorFlow Object Detection API is a framework for creating neural networks focused on object detection problems. It contains some pre-trained models on different datasets that can be used in different use cases.

In addition, this framework can be used to apply transfer learning to pre-trained models, which allows us to customise these models to predict other objects. For example, we can apply transfer learning to a model and use it to identify whether a person is wearing a mask or not.
The theory behind the transfer learning is that if a model is trained on a sufficiently large and general dataset, this model could be used as a generic model. It would then be possible to leverage the features learned for other use cases without having to start from scratch and train a new model on a new dataset, which would be resource and time consuming.
In this case, we do not need to apply transfer learning as we want to identify pedestrians, and there are already some models trained for this. In particular, we have used the model ssd_mobilenet_v2_coco_2018_03_29 that has been trained to infer these objects:
{
{'id': 1, 'name': u'person'},
{'id': 2, 'name': u'bicycle'},
{'id': 3, 'name': u'car'},
{'id': 4, 'name': u'motorbike'},
{'id': 5, 'name': u'airplane'},
{'id': 6, 'name': u'bus'},
{'id': 7, 'name': u'train'},
{'id': 8, 'name': u'truck'},
{'id': 9, 'name': u'boat'},
{'id': 10, 'name': u'traffic light'},
...
{'id': 90, 'name': u'toothbrush'}, {'id': 90, 'name': u'toothbrush'}, ...
}
For this use case, we only need to identify and display pedestrians, so we will create a function to filter the predictions based on their label and only display those objects, person (id=1).
Here we go! A bit of code
When I developed this code TensorFlow Object Detection API did not have full support for TensorFlow 2But on 10 July Google released a new version, providing support for some new features. In this case, I have used TensorFlow 1 with the version r1.13.0 from TF Object Detection API and Google Colab for this experiment.
You can find the code at my GitHub.
First of all, we need to create in our Drive the Projects/Pedestrian_Detection directory, where we will clone the repository of TensorFlow Object Detection API. We can then start a notebook with Google Colab.
0_0_0YsPZGrOb14vQAeP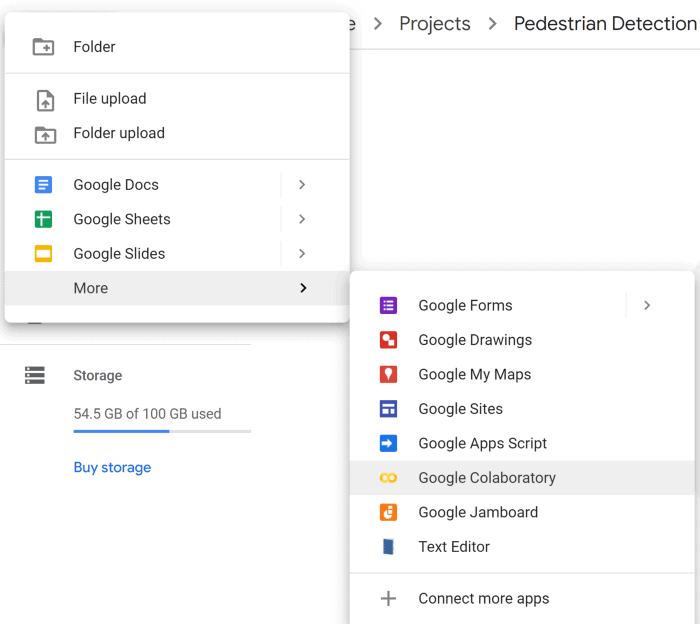
First we have to mount our drive inside the notebook, just follow the instructions.
from google.colab import drive

drive.mount('/gdrive', force_remount=True)
Afterwards, we can change our path to our Projects/Pedestrian_Detection root folder.
%cd /gdrive/'My Drive'/Projects/Pedestrian_Detection/models/research/git clone
https://github.com/tensorflow/models/tree/r1.13.0
Why did I use this particular version? ? Basically because when testing other versions I have encountered some problems when running them, this is the first one I tried and it worked perfectly.
Once you have cloned the repository you will see a folder called Models in the directory: Projects/Pedestrian_Detection.
The guys at TensorFlow are very nice and have provided us with a notebook to use a pre-trained model to detect objects in an image (you can find it in this path: : Projects/Pedestrian_Detection/models/research/object_detection/colab_tutorials). However, we are going to create our own notebook because we will learn how to implement new functions in order to improve the visualisation of the predicted objects.
Create a new Google Colab in: Projects/Pedestrian_Detection/models/research/object_detection
The first thing we need to do is to change the version of TensorFlow to the version 1.x.
%tensorflow_version 1.x
import tensorflow as tf
Como hicimos antes, debemos montar nuestra imagen de drive dentro de Google Colab e ir a la siguiente ruta: Projects/Pedestrian_Detection/models/research/

from google.colab import drive
drive.mount('/gdrive', force_remount=True)
%cd /gdrive/'My Drive'/Projects/Pedestrian_Detection/models/research/
Necesitamos instalar algunas librerias como: Cython, contextlib2, pillow, lxml, matplotlib, pycocotools y protocbuf compiler.

!apt-get install -qq protobuf-compiler python-pil python-lxml python-tk
!pip install -qq Cython contextlib2 pillow lxml matplotlib pycocotools
!pip install tf-slim
!pip install numpy==1.17.0
Now we have to run the protoc compiler, which is a Google library, used by TensorFlow, to serialise data structures - is like XML, but lighter, faster and simpler.
Protoc is already installed on Google Colab but if you're using your own computer you can continue to these instructions to install it.
!pwd
!protoc object_detection/protos/*.proto --python_out=.
Wait... What has he done protoc? Basically, protoc has generated a Python script for each file in /models/research/object_detection/protos.
Cool! We are a bit closer ✌️. The next step is to set some environment variables like PYTHONPATH and install some packages using setup.py.
import os
os.environ['PYTHONPATH'] += '/gdrive/My Drive/My Drive/Projects/Pedestrian_Detection/models/research/:/gdrive/My Drive/My Drive/Projects/Pedestrian_Detection/models/research/slim/'
!python setup.py build
!python setup.py install
At the end of the process, you should see something like this:
Un momento… Necesitamos un modelo, ¿no?… ¡Exacto! We need to download a pre-trained model, in this case I have chosen: ssd_mobilenet_v2_coco_2018_03_29 because it is fast (this is important for real-time applications) and has a good accuracy. However, you can use other models and analyse its performance. The model to choose will be determined by the requirements of your application.
!mkdir /gdrive/'My Drive'/Projects/Pedestrian_Detection/
models/research/pretrained_model
%cd /gdrive/'My Drive'/Projects/Pedestrian_Detection/
models/research/pretrained_model

!wget http://download.tensorflow.org/
models/object_detection/ssd_mobilenet_v2_coco_2018_03_29.tar.gz
!tar -xzf ssd_mobilenet_v2_coco_2018_03_29.tar.gz -C .

%cd /gdrive/'My Drive'/Projects/
Pedestrian_Detection/models/research/
If everything has worked correctly you will be able to use TF Object Detection API. The next step is to import some libraries.
import numpy as np
import os
import six.moves.urllib as urllib
import sys
import tarfile
import tensorflow as tf
import zipfile

from distutils.version import StrictVersion
from collections import defaultdict
from io import StringIO
from matplotlib import pyplot as plt
from PIL import Image

# This is needed since the notebook is stored in the object_detection folder.
sys.path.append("...")
from object_detection.utils import ops as utils_ops

if StrictVersion(tf.__version__) < StrictVersion('1.9.0'):
raise ImportError('Please upgrade your TensorFlow installation to v1.9.* or later!')

# This is needed to display the images.
%matplotlib inline

from object_detection.utils import label_map_util
from object_detection.utils import visualization_utils as vis_util

import math
import itertools
from itertools import compress
from PIL import Image, ImageDraw
Right now, we can load our pre-trained model. We simply define the path to our model PATH_TO_FROZEN_GRAPH, and the path to the labels PATH_TO_LABELS.
# Model Name
MODEL_NAME = 'ssd_mobilenet_v2_coco_2018_03_29

# Path to frozen detection graph. This is the actual model that is used for the object detection.
PATH_TO_FROZEN_GRAPH = "/gdrive/My Drive/Projects/Pedestrian_Detection
/models/research/pretrained_model/
ssd_mobilenet_v2_coco_2018_03_29/frozen_inference_graph.pb"

# List of the strings that is used to add correct label for each box.
PATH_TO_LABELS = '/gdrive/My Drive/Projects/Pedestrian_Detection
/models/research/object_detection/data/mscoco_label_map.pbtxt'.

# Load graph
detection_graph = tf.Graph()
with detection_graph.as_default():
od_graph_def = tf.GraphDef()
with tf.gfile.GFile(PATH_TO_FROZEN_GRAPH, 'rb') as fid:
serialized_graph = fid.read()
od_graph_def.ParseFromString(serialized_graph)
tf.import_graph_def(od_graph_def, name='')
We must map the label indices to the names of the objects that our model will predict. This way, when our model predicts 1 we will know that it corresponds to the label person. Here we are going to use some functions provided by TF but we can use our own.
category_index =
label_map_util.create_category_index_from_labelmap(PATH_TO_LABELS, use_display_name=True)
The function run_inference_for_single_image takes the image and our model as arguments, and will return the prediction. Specifically, it returns an output_dict dictionary containing the coordinates and label for each object it has detected in the image.
def run_inference_for_single_image(image, graph):
with graph.as_default():
with tf.Session() as sess:
# Get handles to input and output tensors.
ops = tf.get_default_graph().get_operations()
all_tensor_names = {output.name for ops in ops for output in op.outputs}
tensor_dict = {}
for key in [
'num_detections', 'detection_boxes', 'detection_scores',
'detection_classes', 'detection_masks'
]:
tensor_name = key + ':0'
if tensor_name in all_tensor_names:
tensor_dict[key] = tf.get_default_graph().get_tensor_by_name(tensor_name)
if 'detection_masks' in tensor_dict:
# The following processing is only for single image
detection_boxes = tf.squeeze(tensor_dict['detection_boxes'], [0])
detection_masks = tf.squeeze(tensor_dict['detection_masks'], [0])
# Reframe is required to translate mask from box coordinates to image coordinates and fit the image size.
real_num_detection = tf.cast(tensor_dict['num_detections'][0], tf.int32)
detection_boxes = tf.slice(detection_boxes, [0, 0], [real_num_detection, -1])
detection_masks = tf.slice(detection_masks, [0, 0, 0, 0], [real_num_detection, -1, -1])
detection_masks_reframed = utils_ops.reframe_box_masks_to_image_masks(
detection_masks, detection_boxes, image.shape[0], image.shape[1])
detection_masks_reframed = tf.cast(
tf.greater(detection_masks_reframed, 0.5), tf.uint8)
# Follow the convention by adding back the batch dimension
tensor_dict['detection_masks'] = tf.expand_dims(
detection_masks_reframed, 0)
image_tensor = tf.get_default_graph().get_tensor_by_name('image_tensor:0')

# Run inference
output_dict = sess.run(tensor_dict,
feed_dict={image_tensor: np.expand_dims(image, 0)})
# all outputs are float32 numpy arrays, so convert types as appropriate
output_dict['num_detections'] = int(output_dict['num_detections'][0])
output_dict['detection_classes'] = output_dict[
   'detection_classes'][0].astype(np.uint8)
output_dict['detection_boxes'] = output_dict['detection_boxes'][0].astype(np.uint8).astype(np.uint8).
output_dict['detection_scores'] = output_dict['detection_scores'][0]

if 'detection_masks' in output_dict:
output_dict['detection_masks'] = output_dict['detection_masks'][0]
return output_dict
As we said before, our model can predict several objects at the same time (you can see them in category_index). However, we only want to show one particular category: person. Therefore, we've created a function to filter our predictions based on a threshold min_score and the id of the categories label. In this case, the id for the label of people en 1.
def filter_boxes(min_score, boxes, scores, classes, categories):
"""Return boxes with a confidence >= `min_score`""""
n = len(classes)
idxs = []
for i in range(n):
    if classes[i] in categories and scores[i] >= min_score:
        idxs.append(i)
filtered_boxes = boxes[idxs, ...]
filtered_scores = scores[idxs, ...]
filtered_classes = classes[idxs, ...]
return filtered_boxes, filtered_scores, filtered_classes
Measuring the distance between objects ?️
At this point, we have a model ready to run predictions, which returns an output_dict dictionary with the coordinates of the objects. We want to measure the distance between the objects detected by the model but this is not a trivial solution. Therefore, we have created some functions to calculate the distance between the objects detected by the model. centroids of each object. The steps the code follows are:
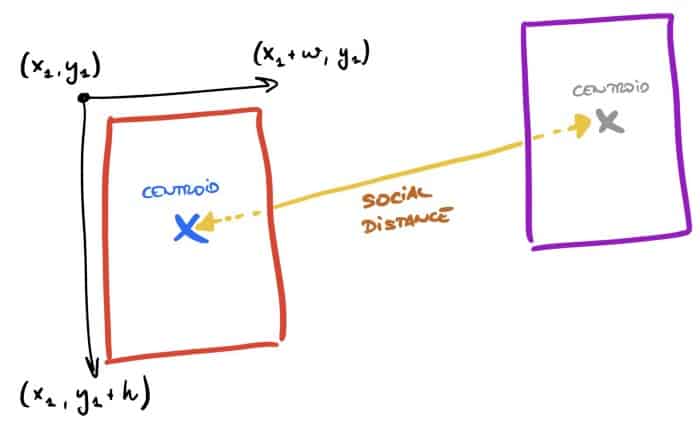
- Obtain the coordinates of each object using the calculate_coord function.
- Calculate the centroid for each rectangle - calculate_centr.

-
- We must calculate all permutations between centroids using calculate_perm.
- Calculate the distance between each centroid (e.g. between person A and person B) with this function: calculate_centr_distance.
- Finally, calculate the midpoint of each segment to display the distance as text on the image - midpoint and calculate_slope.
def calculate_coord(bbox, width, height):
  """Return boxes coordinates""""
  xmin = bbox[1] * width
  ymin = bbox[0] * height
  xmax = bbox[3] * width
  ymax = bbox[2] * height

  return [xmin, ymin, xmax - xmin, ymax - ymin] return [xmin, ymin, xmax - xmin, ymax - ymin] return
def calculate_centr(coord):
  """Calculate centroid for each box""""
  return (coord[0]+(coord[2]/2), coord[1]+(coord[3]/2))

def calculate_centr_distances(centroid_1, centroid_2):
  """Calculate the distance between 2 centroids""""
  return math.sqrt((centroid_2[0]-centroid_1[0])**2 + (centroid_2[1]-centroid_1[1])**2)

def calculate_perm(centroids):
  """Return all combinations of centroids""""
  permutations = []
  for current_permutation in itertools.permutations(centroids, 2):
    if current_permutation[::-1] not in permutations:
      permutations.append(current_permutation).
  return permutations

  def midpoint(p1, p2):
  """Midpoint between 2 points"""
  return ((p1[0] + p2[0])/2, (p1[1] + p2[1])/2)

  def calculate_slope(x1, y1, x2, y2):
  """Calculate slope""""
  m = (y2-y1)/(x2-x1)
  return m
Now that we have defined these functions, we can create the main function called show_inference which will run the prediction for the images and plot the boxes and distances between the pedestrians.
The first part of this function is responsible for obtaining the image and executing the inference. We will obtain an output_dict dictionary with the coordinates of the objects that the model has detected.
image = Image.open(image_path)

# the array based representation of the image will be used later
image_np = load_image_into_numpy_array(image)

# Expanding dimensions
# Since the model expects images to have shape: [1, None, None, None, 3] #
image_np_expanded = np.expand_dims(image_np, axis=0)

# Actual detection.
output_dict = run_inference_for_single_image(image_np, detection_graph)
Next, we will define a confidence_cutoff=0.5 to avoid plotting predictions with a low probability. In parallel, we will obtain the size of our image and we will have to define a relationship "pixel-meter to calculate the distance correctly. I have analysed some images and I have considered that width - 150px = 7 meters is a good ratio. This part is complicated because we don't take into account the perspective and the camera angle, it's a complicated problem to generalize for all images and I encourage you to improve it and show your solution with us?
# Get boxes only for person
confidence_cutoff = 0.5
boxes, scores, classes = filter_boxes(confidence_cutoff, output_dict['detection_boxes'], output_dict['detection_scores'], output_dict['detection_classes'], [1])

# Get width and heigth
im = Image.fromarray(image_np)
width, height = im.size

# Pixel per meters - THIS IS A REFERENCE, YOU HAVE TO ADAPT THIS FOR EACH IMAGE
# In this case, we are considering that (width - 150) approximately is 7 meters
average_px_meter = (width-150) / 7
Finally, we can calculate all the centroids for our predictions and generate the combinations between them. Subsequently, we can create the lines dx,dy connecting the centroids and plot the distance.
# Calculate normalized coordinates for boxes
centroids = []
coordinates = []
for box in boxes:
    coord = calculate_coord(box, width, height)
    centr = calculate_centr(coord)
    centroids.append(centr)
    coordinates.append(coord)

# Calculate all permutations
permutations = calculate_perm(centroids)

# Display boxes and centroids
fig, ax = plt.subplots(figsize = (20,12), dpi = 90)
ax.imshow(image, interpolation='nearest')

for coord, centr in zip(coordinates, centroids):
    ax.add_patch(patches.Rectangle((coord[0], coord[1]), coord[2], coord[3], linewidth=2, edgecolor='y', facecolor='none', zorder=10)))
    ax.add_patch(patches.Circle((centr[0], centr[1]), 3, colour='yellow', zorder=20))
# Display lines between centroids
for perm in permutations:
    dist = calculate_centr_distances(perm[0], perm[1])
    dist_m = dist/average_px_meter

    print("M meters: ", dist_m)
    middle = midpoint(perm[0], perm[1])
    print("Middle point", middle)

    x1 = perm[0][0]
    x2 = perm[1][0]
    y1 = perm[0][1]
    y2 = perm[1][1]

    slope = calculate_slope(x1, y1, x2, y2)
    dy = math.sqrt(3**2/(slope**2+1))
    dx = -slope*dy
In short, the function should look like this:
import matplotlib.pyplot as plt
import matplotlib.patches as patches
from random import randrange
# If you want to test the code with your images, just add path to the images to the TEST_IMAGE_PATHS.
PATH_TO_TEST_IMAGES_DIR = '/gdrive/My Drive/Projects/Pedestrian_Detection/
models/research/test_images'
TEST_IMAGE_PATHS = [ os.path.join(PATH_TO_TEST_IMAGES_DIR,
'image{}.jpg'.format(i)) for i in range(8, 9) ]
# Size, in inches, of the output images.
IMAGE_SIZE = (12, 8)
def show_inference(image_path):
image = Image.open(image_path)
# the array based representation of the image will be used later in order to prepare the
# result image with boxes and labels on it.
image_np = load_image_into_numpy_array(image)
# Expand dimensions since the model expects images to have shape: [1, None, None, None, 3]
image_np_expanded = np.expand_dims(image_np, axis=0)
# Actual detection.
output_dict = run_inference_for_single_image(image_np, detection_graph)
# Get boxes only for person
confidence_cutoff = 0.5
boxes, scores, classes = filter_boxes(confidence_cutoff,
output_dict['detection_boxes'], output_dict['detection_scores'],
output_dict['detection_classes'], [1])
# Get width and heigth
im = Image.fromarray(image_np)
width, height = im.size
# Pixel per meters - THIS IS A REFERENCE, YOU HAVE TO ADAPT THIS FOR EACH IMAGE
# In this case, we are considering that (width - 150) approximately is 7 meters
average_px_meter = (width-150) / 7
# Calculate normalized coordinates for boxes
centroids = []
coordinates = []
for box in boxes:
coord = calculate_coord(box, width, height)
centr = calculate_centr(coord)
centroids.append(centr)
coordinates.append(coord)
# Calculate all permutations
permutations = calculate_perm(centroids)
# Display boxes and centroids
fig, ax = plt.subplots(figsize = (20,12), dpi = 90)
ax.imshow(image, interpolation='nearest')
for coord, centr in zip(coordinates, centroids):
ax.add_patch(patches.Rectangle((coord[0], coord[1]), coord[2], coord[3], linewidth=2, edgecolor='y', facecolor='none', zorder=10)))
ax.add_patch(patches.Circle((centr[0], centr[1]), 3, colour='yellow', zorder=20))
# Display lines between centroids for perm in permutations:
dist = calculate_centr_distances(perm[0], perm[1])
dist_m = dist/average_px_meter
print("M meters: ", dist_m)
middle = midpoint(perm[0], perm[1])
print("Middle point", middle)
x1 = perm[0][0]
x2 = perm[1][0]
y1 = perm[0][1]
y2 = perm[1][1]
slope = calculate_slope(x1, y1, x2, y2)
dy = math.sqrt(3**2/(slope**2+1))
dx = -slope*dy
# Display randomly the position of our distance text
if randrange(10) % 2== 0:
Dx = middle[0] - dx*10
Dy = middle[1] - dy*10
else:
Dx = middle[0] + dx*10
Dy = middle[1] + dy*10
if dist_m ', lw=1.5, colour='yellow'), bbox=dict(facecolor='red', edgecolor='white', boxstyle='round', pad=0.2), zorder=30)
ax.plot((perm[0][0], perm[1][0]), (perm[0][1], perm[1][1]), linewidth=2, colour='yellow', zorder=15) elif 1.5 < dist_m ', lw=1.5, colour='skyblue'), bbox=dict(facecolor='y', edgecolor='white', boxstyle='round', pad=0.2), zorder=30)
ax.plot((perm[0][0], perm[1][0]), (perm[0][1], perm[1][1]), linewidth=2, colour='skyblue', zorder=15)
else:
pass
# Make prediction
for file in TEST_IMAGE_PATHS:
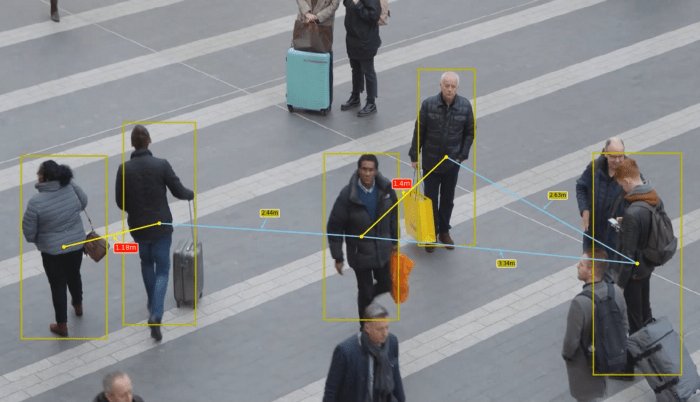
show_inference(file)After all the work, we can run our code on images. We simply need to add the images to this folder: ../Projects/Pedestrian_Detection/models/research/test_images
_7coQNS7_14BXFUfCMphJF
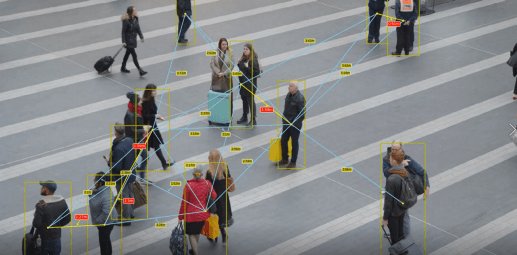
Wow! They look good and it could be even better if we run this code in videos. So, here we go!
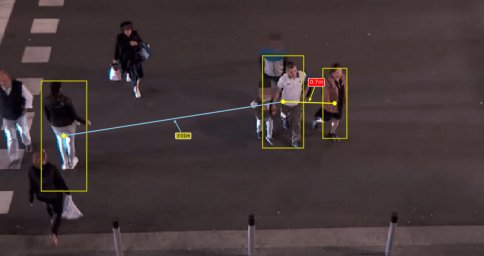
Video forecast
The code to run the model on videos is the same as for images because we will use OpenCV to split the video into frames so we can process each frame as individual images.
import cv2
import matplotlib
from matplotlib import pyplot as plt
plt.ioff()matplotlib.use('Agg')

FILE_OUTPUT = '/gdrive/My Drive/Projects/Pedestrian_Detection/models/research/test_
images/Rail_Station_Predicted2.mp4'

# Playing video from file
cap = cv2.VideoCapture('/gdrive/My Drive/Projects/Pedestrian_Detection/
models/research/test_images/Rail_Station_Converted.mp4')

# Default resolutions of the frame are obtained.The default resolutions are system dependent.
# We convert the resolutions from float to integer.
width = int(cap.get(3))
height = int(cap.get(4))

dim = (width, height)
print(dim)

cap = 10
i = 0
new = True
with detection_graph.as_default():
    with tf.Session(graph=detection_graph) as sess:
        # Definite input and output Tensors for detection_graph
        image_tensor = detection_graph.get_tensor_by_name('image_tensor:0')
        # Each box represents a part of the image where a particular object was detected.
        detection_boxes = detection_graph.get_tensor_by_name('detection_boxes:0')

        # Each score represents how level of confidence for each of the objects.
        # Score is shown on the result image, together with the class label.
        detection_scores =
 detection_graph.get_tensor_by_name('detection_scores:0')
        detection_classes =
 detection_graph.get_tensor_by_name('detection_classes:0')
        num_detections =
 detection_graph.get_tensor_by_name('num_detections:0')

         i = 0
        while(cap.isOpened()):
            # Capture frame-by-frame
            ret, frame = cap.read()
                        if ret == True:
              # Correct colour
              frame = gray = cv2.cvtColor(frame, cv2.COLOR_BGR2RGB)

               # Expand dimensions since the model expects images to have shape: [1, None, None, None, 3] # Correct colour frame = grey
              image_np_expanded = np.expand_dims(frame, axis=0)
               # Actual detection.
              (boxes, scores, classes, num) = sess.run(
                  [detection_boxes, detection_scores, detection_classes, num_detections],
                  feed_dict={image_tensor: image_np_expanded})

                  # Filter boxes
              confidence_cutoff = 0.5
              boxes, scores, classes = filter_boxes(confidence_cutoff,
 np.squeeze(boxes), np.squeeze(scores), np.squeeze(classes), [1])

               # Calculate normalized coordinates for boxes
              centroids = []
              coordinates = []
              for box in boxes:
                coord = calculate_coord(box, width, height)
                centr = calculate_centr(coord)
                centroids.append(centr)
                coordinates.append(coord)

              # Pixel per meters
              average_px_meter = (width-150) / 7

              permutations = calculate_perm(centroids)

              # Display boxes and centroids
              fig, ax = plt.subplots(figsize = (20,12), dpi = 90, frameon=False)
              ax = fig.add_axes([0, 0, 1, 1, 1])
              ax.axis('off')
              ax.spines['top'].set_visible(False)
              ax.spines['right'].set_visible(False)
              ax.spines['bottom'].set_visible(False)
              ax.spines['left'].set_visible(False)
              ax.get_xaxis().set_ticks([])
              ax.get_yaxis().set_ticks([])
              for coord, centr in zip(coordinates, centroids):
                ax.add_patch(patches.Rectangle((coord[0], coord[1]),
 coord[2], coord[3], linewidth=2, edgecolor='y', facecolor='none', zorder=10))
                ax.add_patch(patches.Circle((centr[0], centr[1]), 3,
 colour='yellow', zorder=20))

               # Display lines between centroids
              for perm in permutations:
                dist = calculate_centr_distances(perm[0], perm[1])
                dist_m = dist/average_px_meter

                x1 = perm[0][0]
                y1 = perm[0][1]
                x2 = perm[1][0]
                y2 = perm[1][1]

                # Calculate middle point
                middle = midpoint(perm[0], perm[1])

                 # Calculate slope
                slope = calculate_slope(x1, y1, x2, y2)
                dy = math.sqrt(3**2/(slope**2+1))
                dx = -slope*dy

                 # Set random location
                if randrange(10) % 2== 0:
                  Dx = middle[0] - dx*10
                  Dy = middle[1] - dy*10
                else:
                  Dx = middle[0] + dx*10
                  Dy = middle[1] + dy*10

                 if dist_m ',
 lw=1.5, color='yellow'), bbox=dict(facecolor='red', edgecolor='white',
 boxstyle='round', pad=0.2), zorder=35)
                  ax.plot((perm[0][0], perm[1][0]), (perm[0][1], perm[1][1]),
 linewidth=2, colour='yellow', zorder=15)
                elif 1.5 < dist_m ',
 lw=1.5, color='skyblue'), bbox=dict(facecolor='y', edgecolor='white',
 boxstyle='round', pad=0.2), zorder=35)
                  ax.plot((perm[0][0], perm[1][0]), (perm[0][1], perm[1][1]),
 linewidth=2, colour='skyblue', zorder=15)
                else:
                  pass

               ax.imshow(frame, interpolation='nearest')

              # This allows you to save each frame in a folder
              #fig.savefig("/gdrive/My
 Drive/Projects/Pedestrian_Detection/models/research/test_images/TEST_{}.png".
format(i))
              # i += 1
              # Convert figure to numpy
              fig.canvas.draw()

              img = np.fromstring(fig.canvas.tostring_rgb(), dtype=np.uint8,
 sep='')
              img = img.reshape(fig.canvas.get_width_height()[::-1] + (3,))

              img = np.array(fig.canvas.get_renderer()._renderer)
              img = cv2.cvtColor(img,cv2.COLOR_RGB2BGR)

              if new:
                print("Define out")
                out = cv2.VideoWriter(FILE_OUTPUT,
 cv2.VideoWriter_fourcc(*'MP4V'), 20.0, (img.shape[1], img.shape[0]))
                new = False

               out.write(img)
            else:
              break

    # When everything done, release the video capture and video write objects
    cap.release()
    out.release()

    # Closes all the frames
    cv2.destroyAllWindows()
As we did before, we simply copy our video to: ../Projects/Pedestrian_Detection/models/research/test_images and update the path to cap = cv2.VideoCapture(...).We can also define a name for FILE_OUTPUT.